For geotechnical consultancies & contractors
Know if your site
is sinking
Ten years of satellite radar over any site you bid, study, or build on. A status and a dated PDF report in minutes. Then an email when the movement changes.
The product
One site.
One answer.
Draw your site on a map. Telluric shows where it sinks, how fast, and if that changed.
The east side sinks faster since March
It sank 6 mm/yr from 2015. The rate is now 14 mm/yr. The west side did not change.
- Fastest sinking
- 14 mm/yr
- 0.55 in/yr
- Measurable
- 94% of cells
- Record
- 2015 – 2026
Latest passes
Example site · synthetic data. Screening-grade: it shows where to look. It is not a safety rating.
What the report answers
Three questions
before you design
Did it move before our works?
Every report reaches back to 2015. If someone blames your works for movement, the dated record shows what the ground did before you started.
Is this filled ground still settling?
Reclaimed land, old fill, dredged parcels. See how fast the site settles today, and if the rate slows down.
Does the route cross a sinking bowl?
Draw a rail, pipeline, or canal centerline. See where it crosses sinking ground, as in Houston–Galveston or the Central Valley.
NASA's free displacement map shows raw data. Telluric turns it into a verdict and a dated report you can file. Then it emails you if the movement changes.
How the two compare →The deliverable
The report your
client sees
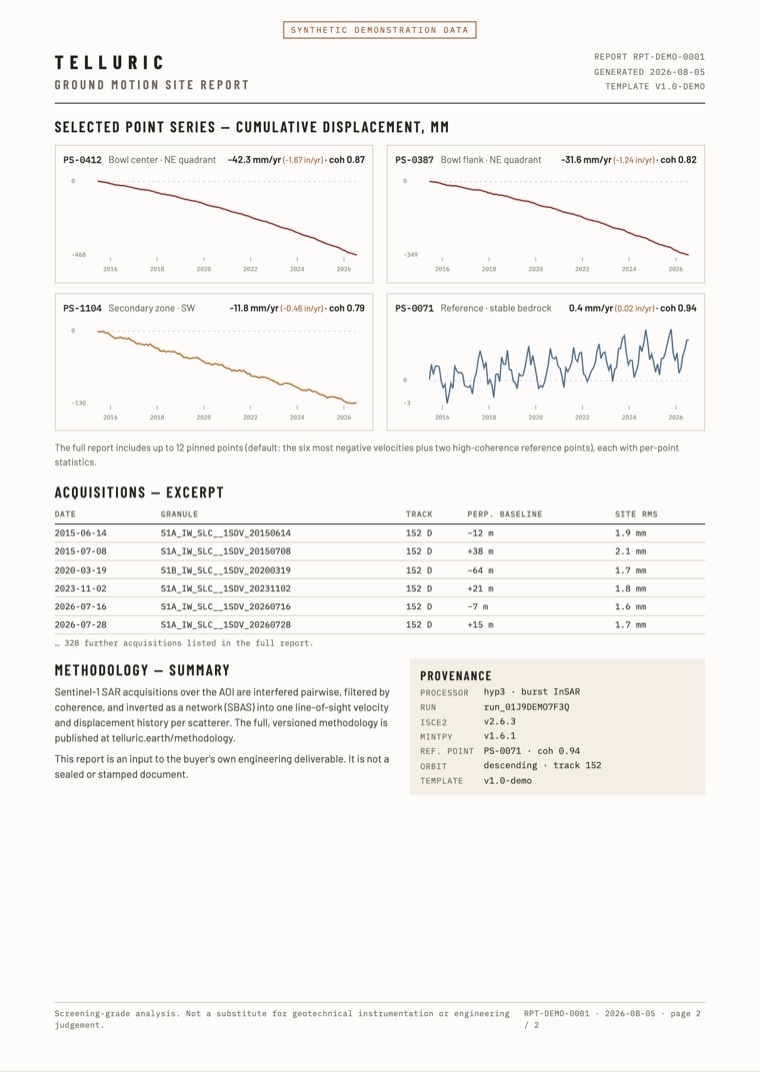
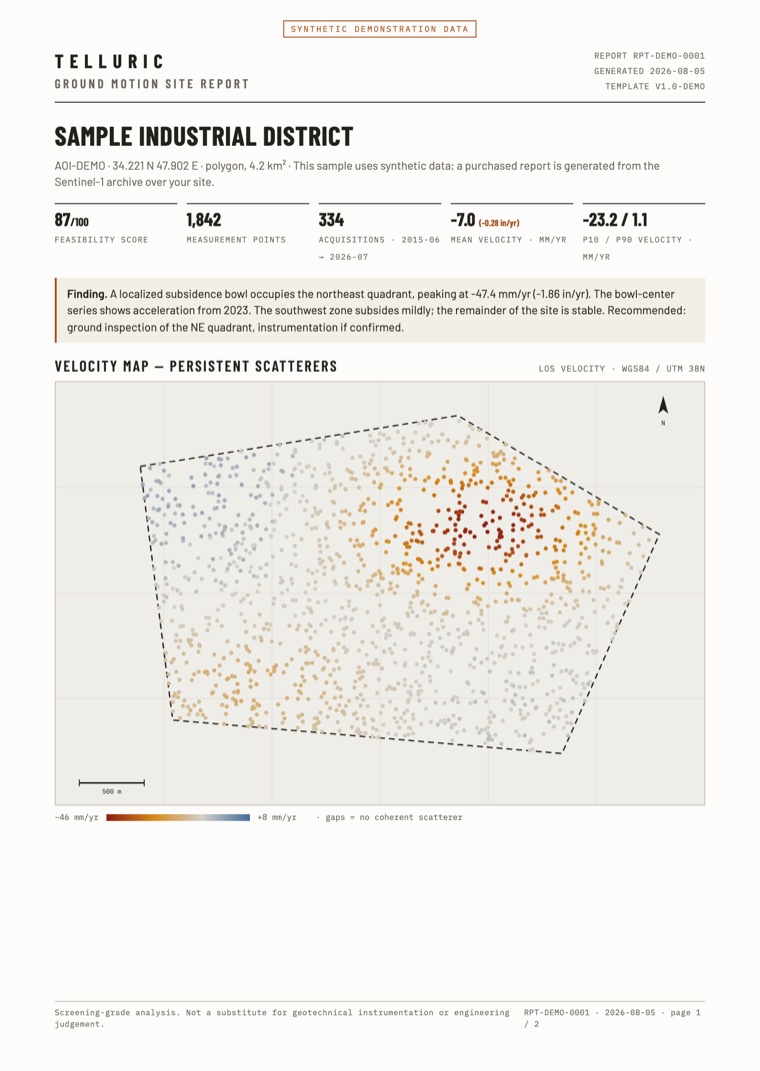
The velocity map, the movement history of each selected point, the list of satellite passes, and the processing record. Use it as an input to your own stamped deliverable.
PDF · two pages · synthetic demonstration data
Monitoring
Every site.
One list.
Telluric reads every new satellite pass. Each site gets a status. If the movement changes, you get an email that says what changed.
Excavation, east block
1.8 km² · last pass 2 days ago
Harbor fill, parcel B
4.2 km² · last pass 5 days ago
Bridge approach, km 12
0.9 km² · last pass 2 days ago
Rail section 3
12 km² · last pass 9 days ago
Canal reach 7
21 km² · last pass 5 days ago
Tank farm, north
2.6 km² · last pass 2 days ago
Quay wall, berth 4
0.6 km² · last pass 5 days ago
Levee, south reach
18 km² · last pass 9 days ago
Telluric alerts
to you
Movement changed at Excavation, east block
The east side sank 6 mm/yr until March. It now sinks 14 mm/yr. The west side did not change.
Before
6 mm/yr
Now
14 mm/yr
Screening-grade. Use it to decide where to inspect.
Example sites · synthetic data. A status shows where to look. It is not a safety rating.
Pricing
Priced like software.
Not like a survey.
A commissioned InSAR study typically costs $10,000–30,000 and takes weeks. Telluric uses the same satellite archive.
Every plan starts with a free account.
We run the feasibility check on your site first.
If the satellites cannot measure it, you pay nothing.
Site Report
One site, one decision
- One site, up to 25 km² (10 mi²)
- Full archive time series, back to 2015
- Rate & acceleration maps
- Branded PDF report, 30-day viewer access
- Pack of 5 for $2,950
- Credited in full if you subscribe within 90 days
Monitor
10 sites, read every pass
- An email when movement on a site changes
- One list with a status for every site
- 10 active sites, up to 25 km² (10 mi²) each
- 2 new site reports every month
- Permanent access to every past site
- Branded PDF reports for your clients
Operations
Fleets, corridors & teams
- Up to 50 sites & corridors, 250 km² (97 mi²) each
- Alerts by email and webhook
- API access, webhooks & multi-user
- Priority processing
- Overage priced per site
Enterprise
Beyond the plan caps: whole portfolios, national networks, regional coverage — for insurers, lenders, and infrastructure owners. Scoped to your coverage and your systems.

The feasibility check is free
Check your site
before you pay
The account is free. Draw your site, and you get a feasibility score from the Sentinel-1 archive in about one minute. You pay only after your site passes.
Telluric readings come from satellite radar and are screening-grade: use them to decide where to inspect. They do not replace geotechnical instrumentation or engineering judgment.