SGMA made subsidence
everyone's line item
Under the Sustainable Groundwater Management Act, land subsidence is one of the six undesirable results that groundwater sustainability agencies must monitor and manage. The state publishes basin-scale data. The gap sits at the scale where subsidence costs money — specific canals, specific recharge basins, specific structures.
The statutory picture
SGMA (2014) requires groundwater sustainability agencies in medium- and high-priority basins to adopt plans that avoid six undesirable results. One of the six is "significant and unreasonable land subsidence that substantially interferes with surface land uses." In practice, every affected GSA needs subsidence monitoring, minimum thresholds, and reporting. Ground movement data stopped being optional and became a plan requirement that the Department of Water Resources reviews. This is orientation, not legal advice — DWR guidance and your agency's counsel govern.
California supports this with public, basin-scale InSAR subsidence data, published through DWR. It is a useful baseline for plan-level reporting. It is also one reason the San Joaquin Valley is among the best-documented subsidence regions anywhere.
Elastic or permanent?
Not all subsidence is equal under a groundwater plan. Aquifer systems compress elastically as heads drop and rebound as they recover — that motion reverses. When clay layers drain past their preconsolidation stress, the compaction is inelastic and the elevation loss is permanent. A minimum threshold written against total displacement without this distinction either overreacts to seasonal cycles or misses the permanent loss inside them.
A single annual survey cannot separate the two. A displacement time series can: seasonal amplitude and recovery show the elastic component, and the trend that remains after each recharge season is the permanent one. Published studies have found satellite-measured displacement tracking piezometric levels closely enough to tell whether a basin's response to curtailment or recharge is holding — which is the question an annual report has to answer.
The gap: asset scale
Subsidence does its damage locally: a canal reach that loses gradient, a bridge approach that settles, a well casing that fails, a recharge basin whose bottom drops. Basin-scale maps show the bowl. To manage infrastructure, you must know what a specific asset did — at what rate, uniformly or differentially, and if the trend responds to actions like pumping curtailment or recharge.
- — For GSAs: a movement history for each asset — along canals, around critical wells. Screening evidence between formal surveys, and trend response for annual reports.
- — For consultants preparing GSPs: site-scale time series to support minimum thresholds and monitoring-network design — from the same public Sentinel-1 archive as the state's data.
- — For infrastructure owners in affected basins: documented evidence for budget requests — "this reach settled X mm since 2015" reads differently than "subsidence is a concern."
The same boundary applies here: these readings help you decide where to instrument and what to report. They are an input to the engineers and hydrogeologists who carry the professional judgment. They do not replace the instrumentation your plan specifies at critical assets.
The deliverable
The report your client sees
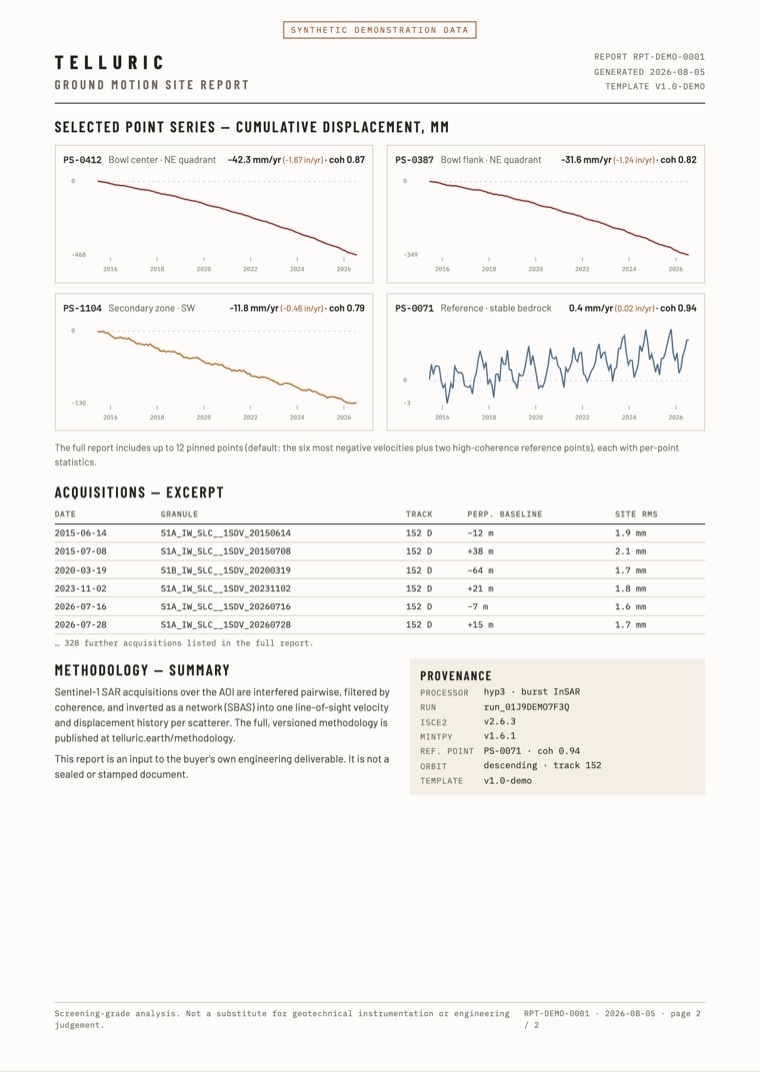
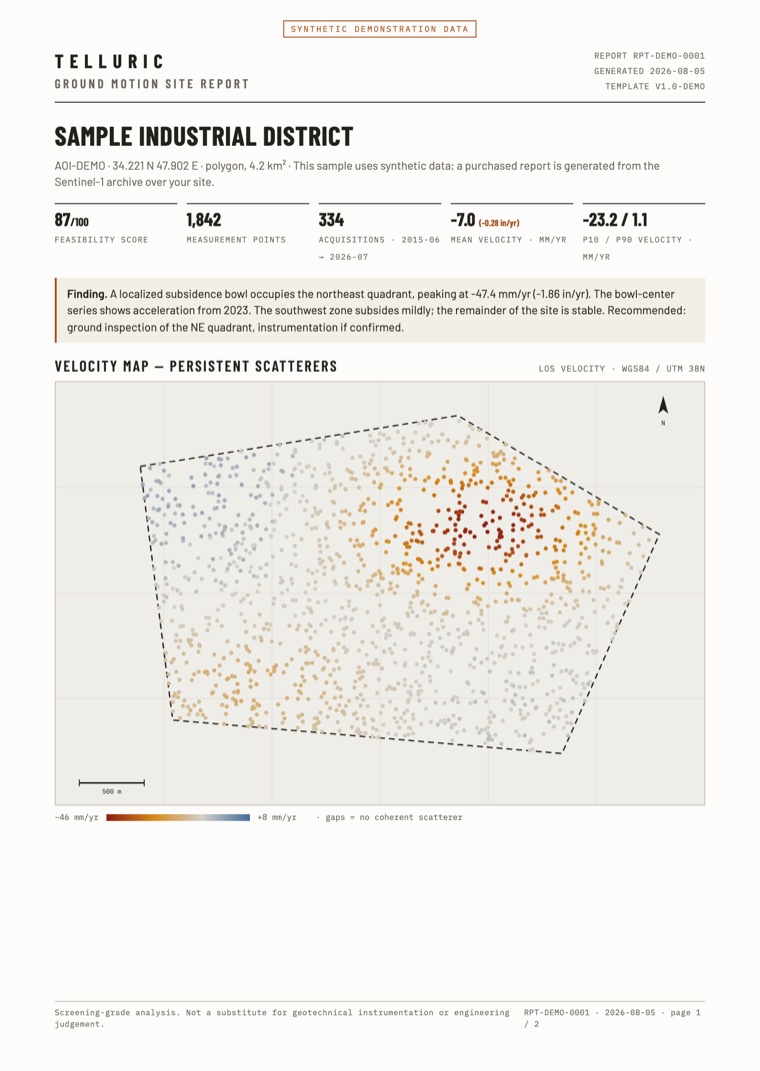
Dated, branded, and traceable: the velocity map, the movement history of every selected point, the acquisition list, and the full processing record. It goes inside your deliverable — it does not replace it.
PDF · two pages · synthetic demonstration data
Check the assets your plan protects
Draw your site, and you get a free feasibility report from the Sentinel-1 radar archive in about one minute. It tells you how many passes cover the site, how often, over what period — and if the satellites can measure it at all. If they cannot, the report says so.
Check your site freeTelluric readings come from satellite radar and are screening-grade: use them to decide where to inspect. They do not replace geotechnical instrumentation or engineering judgment. Read the methodology.