Satellite radar interferometry · every site on Earth
The ground moves.
Now you can see it.
The archive
Ten years of history,
ready on day one
The satellites were already recording. Your first report reaches back to 2015 — including ground no one ever instrumented. No survey you commission today can do that.
Low Earth orbit · footage courtesy of NASA
Platform
A desk study in minutes,
not months
You do not install sensors. You do not send a crew. Nobody needs access to the site. The result is a dated PDF report you can put in front of a client.
Draw your site
A dam, a rail corridor, a district, a whole portfolio.
Read ten years of history
The full radar archive over your site, back to 2015, as a map of measurement cells.
Get an email when it changes
Every new pass is read. If the movement speeds up or changes shape, you get an email.
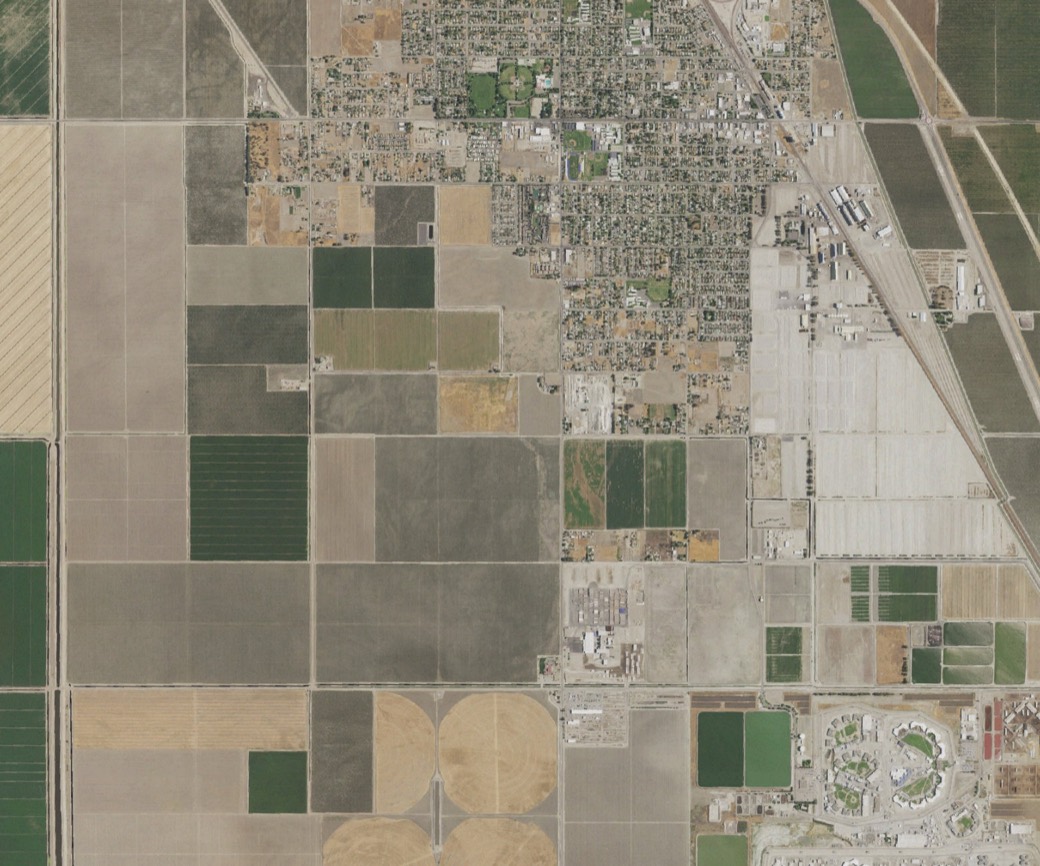
Central Valley, California · USGS NAIP
The method
From orbit
to millimeters
Four processing layers sit between a raw radar echo and a movement history you can act on. Pull them apart below — the full methodology is public.
Illustration · synthetic data — interferogram fringes over a subsidence bowl
- LAYER 01
Raw radar passes
Sentinel-1 takes a radar image of your site every 6–12 days, and it started in 2015. Each pass records phase — a millimeter-precise distance to every ~4 × 20 m patch of ground. One image alone is noise. The signal appears when you compare the images.
- LAYER 02
Pairs become interferograms
The pipeline aligns two neighboring passes to sub-pixel precision and subtracts their phase. The fringe rings show exactly how much the distance from sensor to ground changed between the two dates.
- LAYER 03
Keep the stable echoes
Coherence scores each patch: did the echo stay consistent between visits? The filter keeps buildings, rock, and bare ground. It removes vegetation, water, and drifting sand.
- LAYER 04
Invert the whole network
The solver takes hundreds of overlapping pair measurements at once. It finds the one movement history per cell that explains them all — a rate, and a ten-year time series.
Click any cell. Read ten years.
Each square is one 80 m measurement cell. Color shows how fast the cell moves. Holes are cells that failed quality screening. Click any cell to open its movement history. The scene is simulated — your site works the same way.
DRAG TO PAN · SCROLL TO ZOOM
Cell telemetry
CLICK A CELL ON THE MAP
APPEARS HERE
Your building, or the ground beside it?
Same radar archive, two questions. The area view reads the ground in 80 m squares — available today. The structure view pins a point to each building — in early access.
Where does it sink — and how fast?
One square shows the movement of a patch the size of a city block. It answers area questions: where the bowl is, which end of the site sinks faster, how a corridor behaves. Cells that fail quality screening show as holes.
Does this building move, or the ground next to it?
The structure view puts a point on each structure — a building corner, a bridge deck, a rail track. Each point carries its own millimeter time series, separate from the ground around it.
Both views are screening-grade — they show you where to look, and where to instrument. They do not replace geotechnical instrumentation.
What you get
A new pass every 6–12 days.
An email when the movement changes.
Telluric reads every new pass over your sites. If the movement speeds up or changes shape, you get an email that week — not at the next survey. Subscription tiers.
A free answer first
Draw your site, and we tell you if the satellites can measure it. If they cannot, you pay nothing — and we tell you why.
Ten years on day one
The satellites were already recording. Your first report reaches back ten years. You do not wait for data to accumulate.
A PDF you can hand to your client
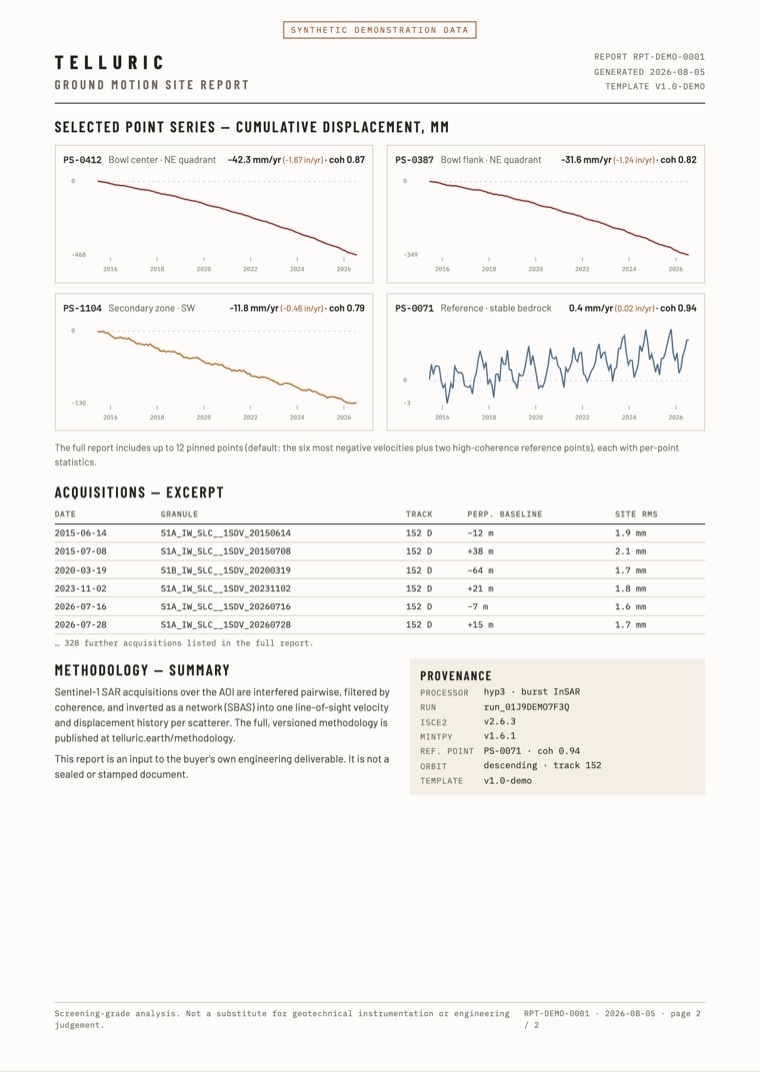
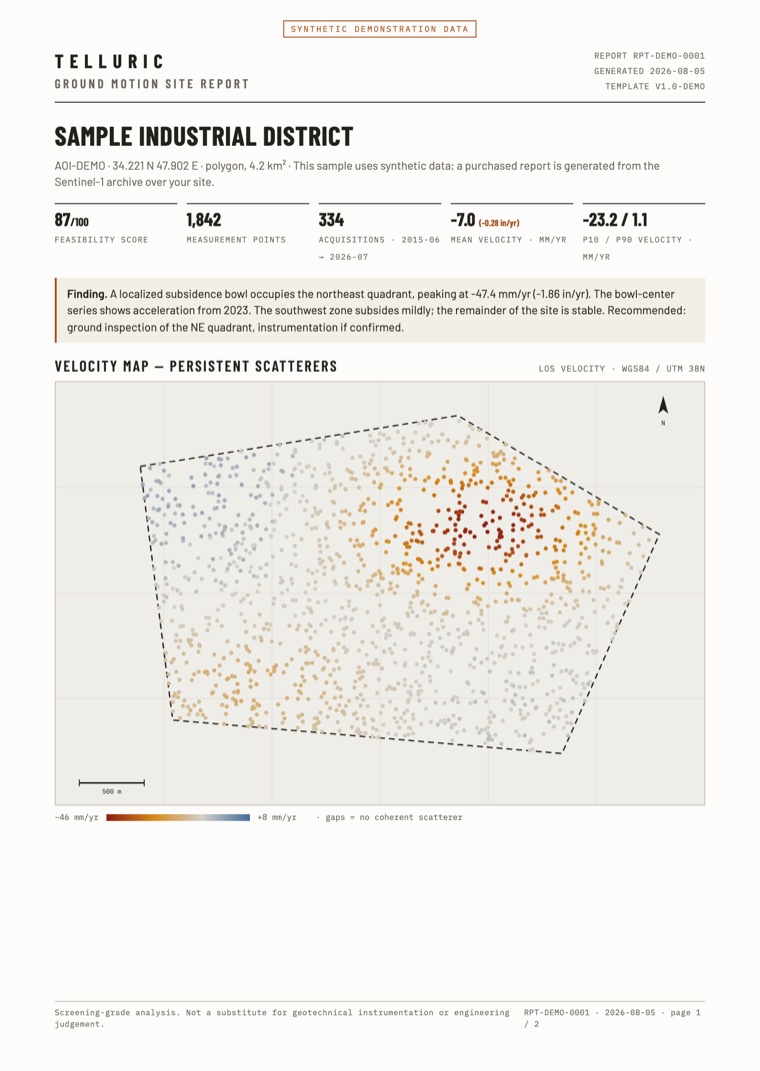
The report is dated and branded. It holds the rates, the history of every cell, and the full processing record. It goes inside your deliverable — it does not replace it.
Every number traceable
Each number carries its acquisition date, satellite pass, and processing versions. When someone questions a number, the record is already there.
Lines, not just plots
For rail, pipeline, or canal: draw the centerline, set a buffer width, and read the whole route.
Any site on Earth
You are not limited to a national grid or a country list. If the satellites cover your site, we process it on demand.
API & webhooks
Pull rates and time series into your own systems. Send the alerts to the tools your team already uses. Operations tier.
The deliverable
The report your
client sees
Dated, branded, and traceable: the velocity map, the movement history of every selected point, the acquisition list, and the full processing record. It goes inside your deliverable — it does not replace it.
PDF · two pages · synthetic demonstration data
Who it is for
Built for people who
answer for the ground
Engineering & geotechnical consultancies
The movement history for every site you bid, study, or sign off — in minutes, at a fraction of a commissioned survey.
Infrastructure owners
Rail, pipelines, ports, and dams — every 6–12 days, including regions where no ground motion service exists.
Construction & tunneling
Independent evidence that your works moved the neighbors — or that they did not.
Insurers & lenders
Query a whole portfolio for subsidence from one API. See which assets sink, and how fast.
A screening tool: it shows you where to look — and where to put the instruments. It does not replace them.
Pricing
Priced like software.
Not like a survey.
A commissioned InSAR study typically runs $10,000–30,000 and takes weeks. This is the same archive, priced like software.
Every plan starts with a free account.
We run the feasibility check on your site first.
If the satellites cannot measure it, you pay nothing.
Site Report
One site, one decision
- One site, up to 25 km²
- Full archive time series, back to 2015
- Rate & acceleration maps
- Branded PDF report, 30-day viewer access
- Pack of 5 for $2,950
- Credited in full if you subscribe within 90 days
Professional
Every bid, every month
- 2 new site reports every month
- 10 active sites, up to 25 km² each
- Permanent access to every past site
- Quarterly refreshes of your baselines
- Branded PDF reports for your clients
Operations
Fleets, corridors & teams
- Up to 50 sites & corridors, 250 km² each
- Continuous monitoring & alerting
- API access, webhooks & multi-user
- Priority processing
- Overage priced per site
Enterprise
Beyond the plan caps: whole portfolios, national networks, regional coverage — for insurers, lenders, and infrastructure owners. Scoped to your coverage and your systems.

The first site is free
See ten years of movement
under your site
The account is free. Draw your site, and you get a real feasibility score from the Sentinel-1 archive in about one minute. You pay only after your site passes.
Telluric readings come from satellite radar and are screening-grade: use them to decide where to inspect. They do not replace geotechnical instrumentation or engineering judgment.